

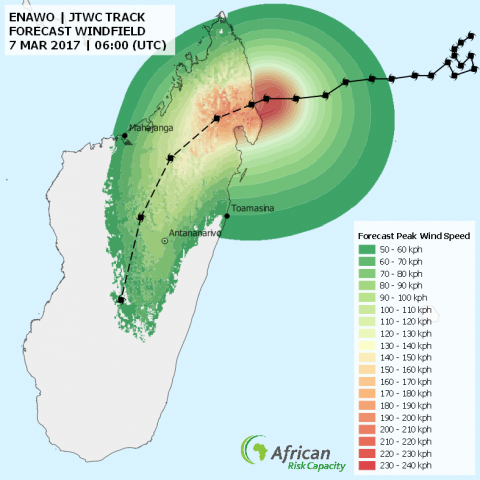
[box type="shadow" class="" width="" background=#000000]The African Risk Capacity monitors tropical cyclone activity in the South-West Indian Ocean (SWIO) and relies on Africa RiskView, a disaster risk modelling platform that uses satellite-based and other geo-information to forecast wind speed and storm surge height and estimate population affected and economic loss. These modelled lesses are the underlying basis of the insurance policies issued by the ARC Insurance Company Limited, the financial affiliate of the ARC Agency, which pools risk across the continent.[/box]
| Name | Event Number | Naming Date | Current Position | Current Wind Speed |
| ENAWO | 09 | 03/03/2017 | -14.6S 50.6E | 231.5 km/h |
 The following map shows the forecast peak surge depth at the time of reporting:
 NB: It is important to note that these maps are based on forecasts, which will be updated as soon as the next update on the cyclone track is released.
[/tab]
[tab]
The following graph(s) show the peak wind speed (and surge depth where applicable) for selected locations. The x-axis represents the timeline, which can include both actual and forecast wind speed (and surge depth where applicable):
NB: It is important to note that these graphs are based on forecasts, which will be updated as soon as the next update on the cyclone track is released.
[caption id="attachment_1125" align="aligncenter" width="797"]
NB: It is important to note that these maps are based on forecasts, which will be updated as soon as the next update on the cyclone track is released.
[/tab]
[tab]
The following graph(s) show the peak wind speed (and surge depth where applicable) for selected locations. The x-axis represents the timeline, which can include both actual and forecast wind speed (and surge depth where applicable):
NB: It is important to note that these graphs are based on forecasts, which will be updated as soon as the next update on the cyclone track is released.
[caption id="attachment_1125" align="aligncenter" width="797"] Antananarivo[/caption]
[caption id="attachment_1126" align="aligncenter" width="797"]
Antananarivo[/caption]
[caption id="attachment_1126" align="aligncenter" width="797"] Toamasina[/caption]
[/tab]
[tab]
Toamasina[/caption]
[/tab]
[tab]
Based on the forecasts presented under the previous tabs, Africa RiskView calculates the potential number of people affected by the tropical cyclone. The table below shows the number of people affected (by different categories of wind speed). It is important to note that these are forecast-based and thus subject to change as soon as the next update on the cyclone track is released:
| Location / Category | Population affected | |
|---|---|---|
| MADAGASCAR | ||
| ANTANANARIVO | ||
| - Weak Tropical Storm | 5,556,270 | 86.5% |
| - Strong Tropical Storm | 104,213 | 1.6% |
| ANTSIRANANA | ||
| - Weak Tropical Storm | 1,458,880 | 88.0% |
| - Strong Tropical Storm | 933,112 | 56.3% |
| - Category 1 (74-95mph) | 792,404 | 47.8% |
| - Category 2 (95-110mph) | 534,373 | 32.2% |
| - Category 3 (111-129mph) | 233,173 | 14.1% |
| - Category 4 (130-156mph) | 17,886 | 1.1% |
| FIANARANTSOA | ||
| - Weak Tropical Storm | 556,002 | 11.8% |
| MAHAJANGA | ||
| - Weak Tropical Storm | 1,788,585 | 73.6% |
| - Strong Tropical Storm | 1,278,828 | 52.6% |
| - Category 1 (74-95mph) | 743,348 | 30.6% |
| - Category 2 (95-110mph) | 322,084 | 13.2% |
| - Category 3 (111-129mph) | 97,326 | 4.0% |
| TOAMASINA | ||
| - Weak Tropical Storm | 1,907,643 | 52.5% |
| - Strong Tropical Storm | 787,464 | 21.7% |
| - Category 1 (74-95mph) | 356,682 | 9.8% |
| - Category 2 (95-110mph) | 229,852 | 6.3% |
| - Category 3 (111-129mph) | 136,964 | 3.8% |
| - Category 4 (130-156mph) | 1,221 | 0.0% |